In statistics grad school, co-authored "Bayesball", a relatively early (Bayesian) model for fielding that used location information about all batted balls.
Our method was called SAFE = Spatial Aggregate Fielding Evaluation (Annals of Applied Statistics, 2009)
I've also dabbled with some basketball and football statistics...
Today's Outline
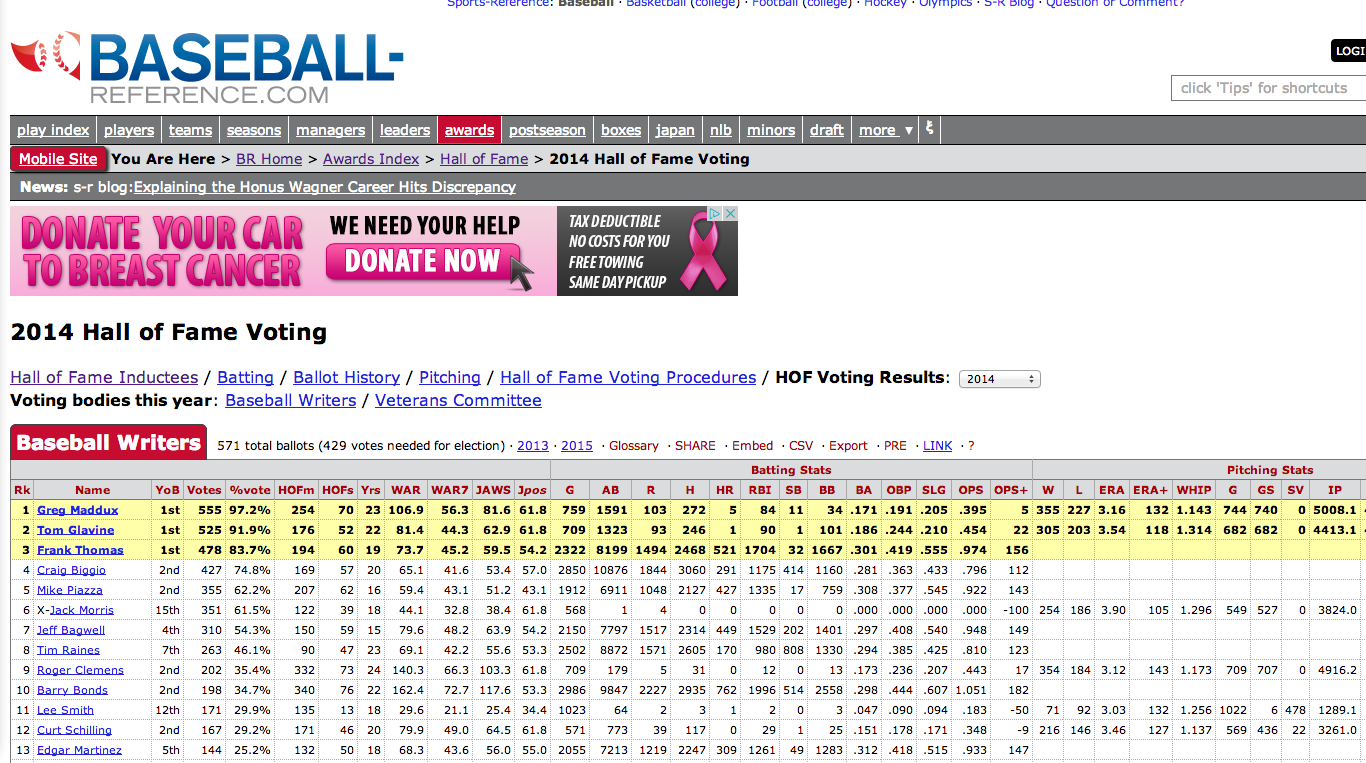
Introduction: Baseball Hall of Fame voting is awful
But... if you can't beat 'em, join 'em
Part 1: Visualize the data
Part 2: Model the outcome
Collaborators
Joint work with:
Carlos Scheidegger (University of Arizona)
and
Carson Sievert (Iowa State University)
Introduction: Baseball Hall of Fame Voting is Awful
First, the rules:
A player can appear on the ballot after having played for at least 10 years and having been retired for at least 5 years.
A committee chooses who appears on the ballot, and they are... "generous"
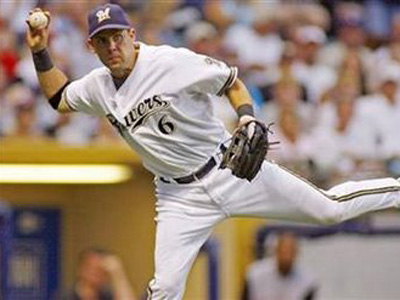
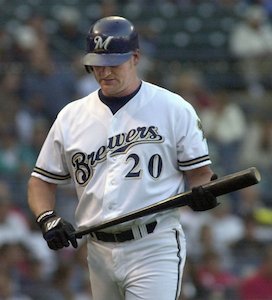
Jeff Cirillo
Jeff Cirillo, 3B, 1994 - 2007: .296 BA, 112 HR, 32 WAR, 2 All-Star Teams, 2013 HOF ballot
Dan Plesac, P, 1986 - 2003: 65 - 71 Win-Loss, 3.64 ERA, 17.2 WAR, 3 All-Star Teams, 2009 HOF ballot
These are just a few players who have appeared on the ballot
... and these are just some of the former Brewers!
None of them received a single HOF vote, thankfully.
Unlike:
##               Name Year  WAR Votes NumBallots
## 1     Jacque Jones 2014 11.5     1        571
## 2      David Segui 2010  7.8     1        539
## 3   Shawon Dunston 2008  9.1     1        543
## 4       Walt Weiss 2006 14.6     1        520
## 5      Randy Myers 2004 14.2     1        506
## 6    Cecil Fielder 2004 14.7     1        506
## 7       Mark Davis 2003  6.8     1        496
## 8     Jim Deshaies 2001 10.2     1        515
## 9  Steve Bedrosian 2001 13.2     1        515
## 10      Ray Knight 1994 10.9     1        456
More Rules:
About 625 members (as of 2014) of the Baseball Writers Association of America (BBWAA) receive a ballot, and 570 of them voted last year.
Ballots are due by 12/31, and results are announced in the first week of January.
A player must be selected on at least 75% of the returned ballots to be inducted into the HOF that year.
In 1967 they started to enforce the rule that if you appear on less than 5% of ballots, you are permanently removed from future ballots.
A player may appear on a maximum of 15 ballots (i.e. consecutive years) before being permanently removed.
In a given year, each voter may vote for as few as 0 players, and as many as 10 players (where an average year's ballot contains about 40 players).
Some Statistics
1936 was the first year of Hall of Fame voting
Five players were elected:
##   Year              Name Pos NumBallots Votes Percentage
## 1 1936           Ty Cobb  OF        226   222     98.20%
## 2 1936      Honus Wagner  SS        226   215     95.10%
## 3 1936         Babe Ruth  OF        226   215     95.10%
## 4 1936 Christy Mathewson   P        226   205     90.70%
## 5 1936    Walter Johnson   P        226   189     83.60%
From 1936 - 2014, 1089 unique players have appeared on the ballot
115 have been elected, 47 on their first ballot appearance (not Lou Gehrig, Cy Young, Warren Spahn)
Famously, no player has been unanimously elected.
We consider 1967 to be the first year of 'modern' HOF voting (when the 5% rule was established)
Some Problems
Does it really take 15 years to decide?
The so-called 'morals' clause, rule 5 out of 9:
Voting: Voting shall be based upon the player's record, playing ability, integrity, sportsmanship, character, and contributions to the team(s) on which the player played.
Q: Does that mean some Hall of Fame voters don’t even cover baseball any more?
A: Yes. The BBWAA trusts that its voters take their responsibility seriously, and even those honorary members who are no longer covering baseball do their due diligence to produce a thoughtful ballot.
(from http://bbwaa.com/voting-faq/)
Some Responses
Will Leitch: "Voter Fraud" 11/14/2013, sportsonearth.com
Stupid things are called out as stupid, and people try to figure out how to correct them. It's encouraging. It's kinda nice. And then there is Baseball Hall of Fame voting.
Jonathan Mahler: "Kill The HOF Character Clause, For The Sake Of The Writers", 1/10/2013, deadspin.com
Deadspin offered to buy a vote in 2013, and mainstream journalist Dan Le Batard (Miami Herald) gave his vote to the website (for no money). He was banned for life from voting on future HOF ballots.
Last month the BBWAA announced that they will only allow players to appear up to 10 times on the ballot, rather than 15. (with Mattingly, Trammell, and Smith grandfathered in to the 15-year clock)
My Thoughts
In a nutshell: the voting process is a phenomenon unto itself. It is not a yes-or-no question!
We might as well embrace this, and study it.
(Hasn't baseball always been famous for embracing the 'human element' of the game?)
Part 1: Visualize the data
Getting the data
Baseball Reference has it all! Fantastic website.
Career statistics and voting percentages for each player, each year, from 1936-2014.
We did a bit of web scraping to download and parse each year's ballot.
A few plots in R
We were really interested in the trajectories of voting percentages of players who had appeared on the ballot multiple times.
Dips in voting percentages for most players when a group of strong first-ballot players appears (1999, 2007)
Edd Roush's 19 ballots
Minnie Minoso and Jose Rijo's comebacks
Warren Spahn's early vote
HR > 400
OPS > .850
Part 2: Model the data and make predictions
The obvious next question is: Can we predict next year's vote?
Others have worked on this, of course:
JAWS: Jay Jaffe's 'Jaffe WAR Scoring System', an average of WAR and 'peak' WAR, normalized for position
Bill James has a few systems. Hall of Fame Monitor, for example, as described on baseball-reference.com (leader glossary section):
[1] For Batting Average, 2.5 points for each season over .300, 5.0 for over .350, 15 for over .400. Seasons are not double-counted. I require 100 games in a season to qualify for this bonus.
[2] For hits, 5 points for each season of 200 or more hits.
[3] 3 points for each season of 100 RBI's and 3 points for each season of 100 runs.
[4] 10 points for 50 home runs, 4 points for 40 HR, and 2 points for 30 HR.
[5] 2 points for 45 doubles and 1 point for 35 doubles.
[6] 8 points for each MVP award and 3 for each AllStar Game, and 1 point for a Rookie of the Year award.
[7] 2 points for a gold glove at C, SS, or 2B, and 1 point for any other gold glove.
[8] 6 points if they were the regular SS or C on a WS winning team, 5 points for 2B or CF, 3 for 3B, 2 for LF or RF, and 1 for 1B. I don't have the OF distribution, so I give 3 points for OF (requires at least 82 games as the position).
...
[19] ...
Michael Freiman's paper in JQAS a few years back. Random Forests for 0/1 induction into HOF.
Mills and Salaga, 2011 JQAS paper using random forests as well.
Most of these focus on the yes/no question of induction, rather than predicting voting percentages.
What predictors should we use?
Career Statstics? (including position, of course)
Awards? (Rookie of the Year, MVP, All-star appearnaces, Gold glove awards, etc.)
Measures of post-season success?
Measures of popularity with the press/public?
We used the first two, and the third should be easy to incorporate in future work. The fourth is a little tougher. (Some type of meta-analysis on newspaper articles, perhaps?)
What data do we use?
I'll talk about making predictions last year (ballots were due 12/31/13, and results were announced January, 2014), and I'll finish by presenting my 2015 predictions.
We discarded anybody whose first year of eligibility was before 1967.
Through the 2013 vote, this gave us a historical data set of:
406 position players
229 pitchers
= 635 total unique players
and 1458 total data points, or voting outcomes (for an average of 2.3 years on the ballot per person)
We'll test the accuracy of our model by making one-year-ahead (out-of-sample) predictions, starting in 1997, and going through 2014.
Our methodology:
For each year, we fit a different model to the historical data from three different subsets of players:
First-ballot batters
First-ballot pitchers
Returning ballot players
Career statistics are basically all we have for the first two groups.
For the third group, we have their previous HOF voting percentages, of course. (which should make our job much easier)
Modeling:
All the models we fit were logistic regression models: assume the n voters in a given year act independently, and model the number of 'yes' votes as a binomial random variable: yit ∼ Binom(nt, pit), where
yit is the number of 'yes' votes for player i in year t
nt is the number of ballots returned in year t, and
pit is the probability of a given voter voting 'yes' for player i in year t.
Next, model pit as a linear function of the predictor variables: pit = β0 + β1XiHR + β2XiRBI + β3XiOBP + ... for batters, for instance.
An alternative would be to use something like random forests, support vector machines, or whatever. We tried random forests and got similar results, and logistic regression is easy and interpretable, so we chose it.
Given the estimated regression coefficients, β0, β1, ..., and the predictors for the players on next year's ballot, we can easily compute an estimate of pit for them.
Baseline Model:
# Group 1: batters
var.names[[1]] <-c("Yrs", "G", "AB", "R", "H", "HR", "RBI", "SB", "BB",
"BA", "OBP", "SLG",
"posC", "pos1B", "pos2B", "pos3B", "posSS", "posLF", "posCF", "posRF")
# Group 2: pitchers
var.names[[2]] <-c("Yrs", "W", "L", "G", "GS", "SV", "IP", "H", "HR", "BB", "SO",
"ERA", "WHIP")
# Group 3: returning players# Just use the previous year's voting percentage as the sole predictor
var.names[[3]] <-c("prev1")
Let's head back in time... to 1996:
Example: First-ballot batters from 1967 - 1996 (n = 255):
# Fit the model using weak priors:
fit <-bayesglm(data[sel, "p"] ~X.scale, weights=data[sel, "NumBallots"],
family=binomial(link ="logit"),
prior.mean=0, prior.scale=2.5)
Example: First-ballot batters from 1967 - 1996 (n = 255):
OBP has a negative coefficient? But SLG and BA are positive... (and of course, coefficients for correlated predictors in linear models can't be interpreted in isolation).
Making out-of-sample predictions for 1997:
             Name Prediction Actual
1     Dave Parker       39.4   17.5
2    Dwight Evans       51.8    5.9
3     Ken Griffey       12.7    4.7
4 Garry Templeton        5.3    0.4
5   Terry Kennedy        0.5    0.2
6      Terry Puhl        0.2    0.2
Pretty bad!
The RMSE here (for the percentage difference) is about 21%.
If we had just guessed the intercept for everybody we would have gotten a 25% RMSE.
But this is a tiny sample...
Overall Results for Baseline Model:
Pseudo-code:
for (year in 1997:2014) {
for (group in c("batters", "pitchers", "returning")) {
train <-Year <year &Group ==group
test <-Year ==year &Group ==group
historical.fit <-glm(y[train] ~data[train, ])
predict <-predict(historical.fit, newdata=data[test, ])
}
}
Group
Baseline
First-ballot Batters (n = 151)
18.4%
First-ballot Pitchers (n = 85)
9.7%
Returning Players (n = 262)
5.7%
Overall
11.7%
Let's make 2014 Predictions
              Name Previous Predicted
1     Craig Biggio     68.2      77.0
2      Jack Morris     67.7      76.5
3     Jeff Bagwell     59.6      67.5
4      Mike Piazza     57.8      65.3
5       Tim Raines     52.2      58.0
6        Lee Smith     47.8      52.0
7   Curt Schilling     38.8      39.7
8     Frank Thomas      0.0      39.2
9        Jeff Kent      0.0      38.7
10   Roger Clemens     37.6      38.1
11     Greg Maddux      0.0      37.5
12     Barry Bonds     36.2      36.3
13  Edgar Martinez     35.9      35.9
14   Alan Trammell     33.6      33.0
15   Luis Gonzalez      0.0      23.0
16    Larry Walker     21.6      20.3
17    Fred McGriff     20.7      19.5
18    Mark McGwire     16.9      16.4
19    Mike Mussina      0.0      16.3
20     Tom Glavine      0.0      15.1
21   Don Mattingly     13.2      13.8
22      Sammy Sosa     12.5      13.3
23 Rafael Palmeiro      8.8      11.1
24     Moises Alou      0.0      10.5
25      Ray Durham      0.0       7.1
26 Armando Benitez      0.0       3.3
27      Sean Casey      0.0       0.9
28      Eric Gagne      0.0       0.8
29   Richie Sexson      0.0       0.6
30    Paul Lo Duca      0.0       0.5
31       J.T. Snow      0.0       0.4
32    Kenny Rogers      0.0       0.4
33      Hideo Nomo      0.0       0.2
34    Jacque Jones      0.0       0.1
35      Todd Jones      0.0       0.1
36     Mike Timlin      0.0       0.1
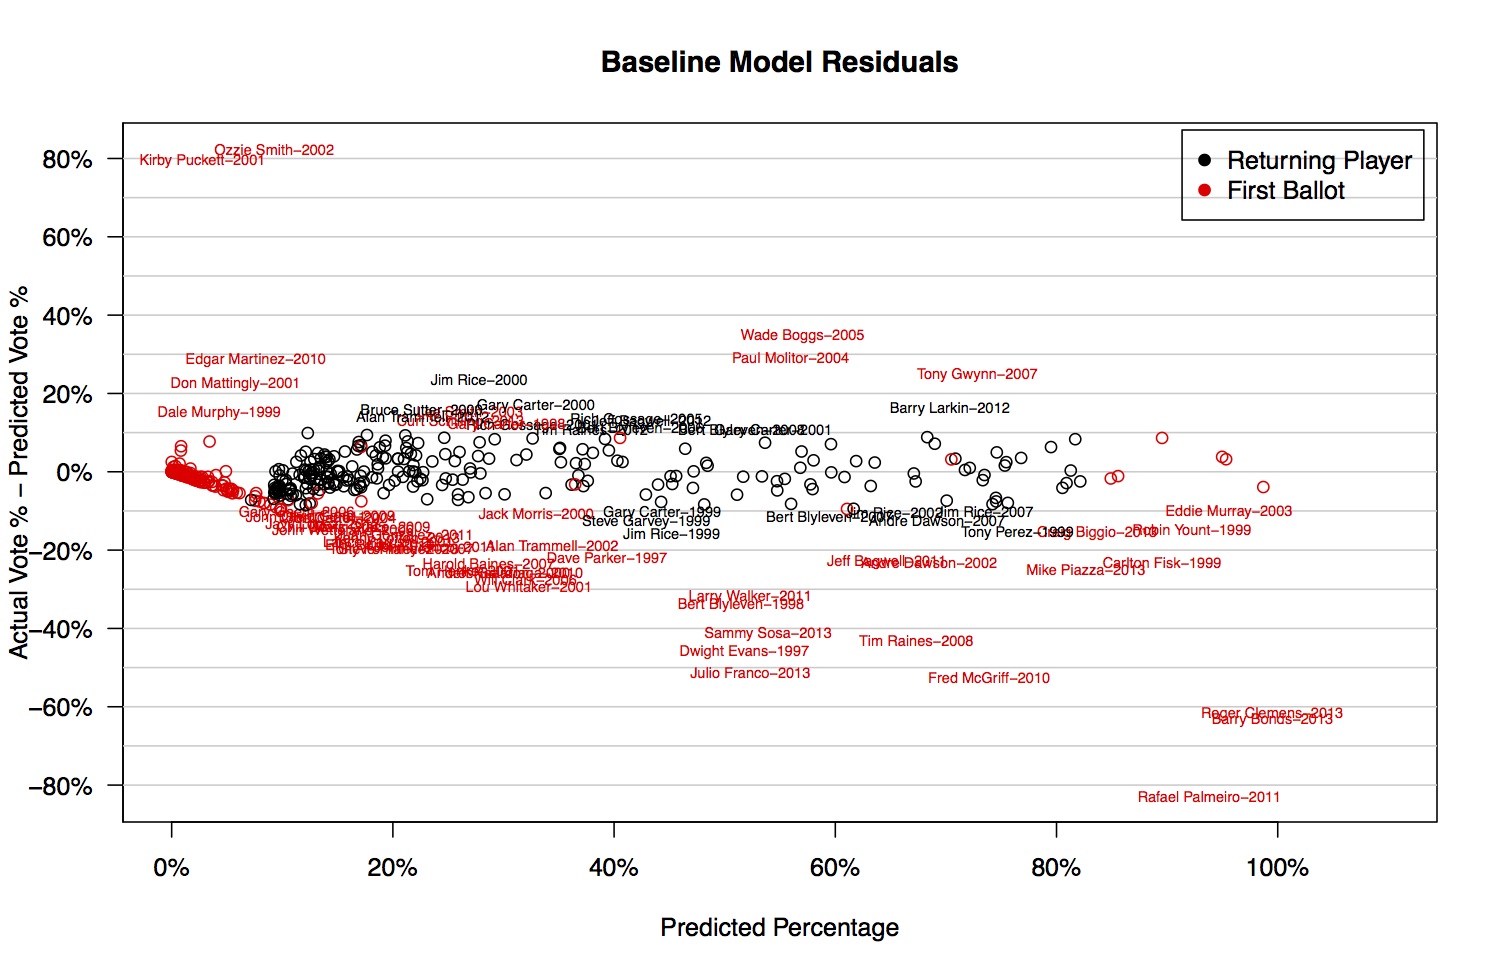
Residuals for Baseline Model
Residual Analysis:
Stats 101: Fit a model, look at the residuals, see if you can think of a variable to incorporate that would explain some of the residuals.
  Year            Name Actual Predicted Residual
1 2002     Ozzie Smith   91.7       9.3     82.4
2 2001   Kirby Puckett   82.1       2.8     79.3
3 2005      Wade Boggs   91.9      57.1     34.8
4 2004    Paul Molitor   85.2      56.0     29.2
5 2010  Edgar Martinez   36.2       7.6     28.6
1 2011 Rafael Palmeiro   11.0      93.8    -82.8
2 2013     Barry Bonds   36.2      99.5    -63.3
3 2013   Roger Clemens   37.6      99.5    -61.9
4 2010    Fred McGriff   21.5      73.9    -52.4
5 2013    Julio Franco    1.1      52.3    -51.3
Let's try:
Awards, like All-Star teams and Gold Gloves, and...
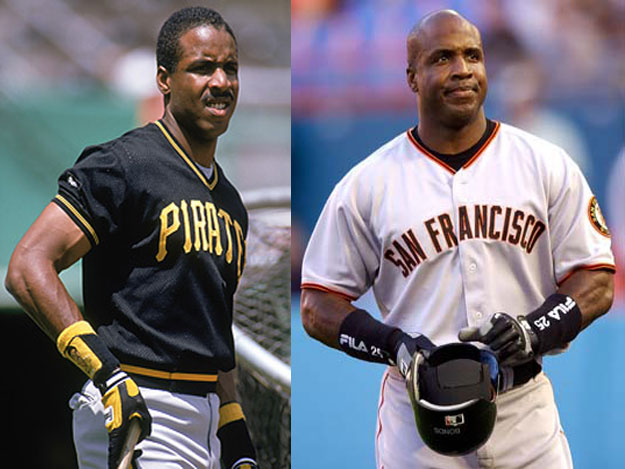
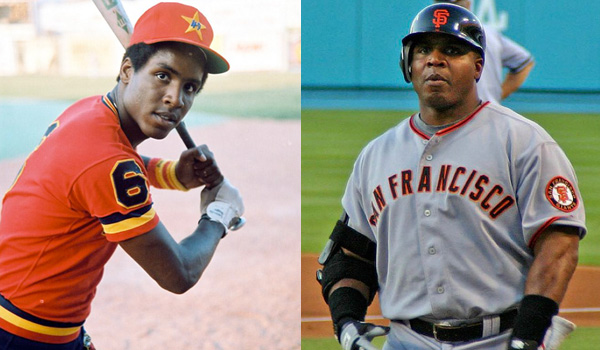
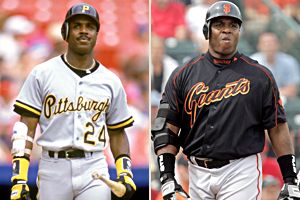
Drugs! (i.e. steroid or HGH suspicion or suspension) Specifically, we can gather data on drug suspensions, and on being named in the Mitchell Report, as our proxy for suspected use.
A side note...
Don't google image search "Barry Bonds before vs. after" unless you have half an hour to kill...
A side note...
Don't google image search "Barry Bonds before vs. after" unless you have half an hour to kill...
A side note...
Don't google image search "Barry Bonds before vs. after" unless you have half an hour to kill...
People have really put a lot of work into this sort of comparison
Related searches: McGwire, Clemens, Sosa.
Model 2 ('Awards + Drugs'), Batters from 1967 - 2013:
Nice -- the z-scores for the three new predictors are highly significant, and have signs that we expected.
New RMSE results:
Group
Baseline
Awards + Drugs
First-ballot Batters (n = 151)
18.4%
15.2%
First-ballot Pitchers (n = 85)
9.7%
8.6%
Returning Players (n = 262)
5.7%
5.7%
Overall
11.7%
10.0%
Updated 2014 predictions:
              Name Previous Predicted
1      Greg Maddux      0.0      96.0
2     Craig Biggio     68.2      77.0
3      Jack Morris     67.7      76.5
4     Jeff Bagwell     59.6      67.5
5      Mike Piazza     57.8      65.3
6       Tim Raines     52.2      58.0
7     Mike Mussina      0.0      57.7
8        Lee Smith     47.8      52.0
9     Frank Thomas      0.0      51.0
10     Tom Glavine      0.0      50.5
11  Curt Schilling     38.8      39.7
12   Roger Clemens     37.6      38.1
13     Barry Bonds     36.2      36.3
14  Edgar Martinez     35.9      35.9
15   Alan Trammell     33.6      33.0
16   Luis Gonzalez      0.0      20.9
17    Larry Walker     21.6      20.3
18    Fred McGriff     20.7      19.5
19    Mark McGwire     16.9      16.4
20   Don Mattingly     13.2      13.8
21      Sammy Sosa     12.5      13.3
22     Moises Alou      0.0      13.1
23 Rafael Palmeiro      8.8      11.1
24       Jeff Kent      0.0      11.0
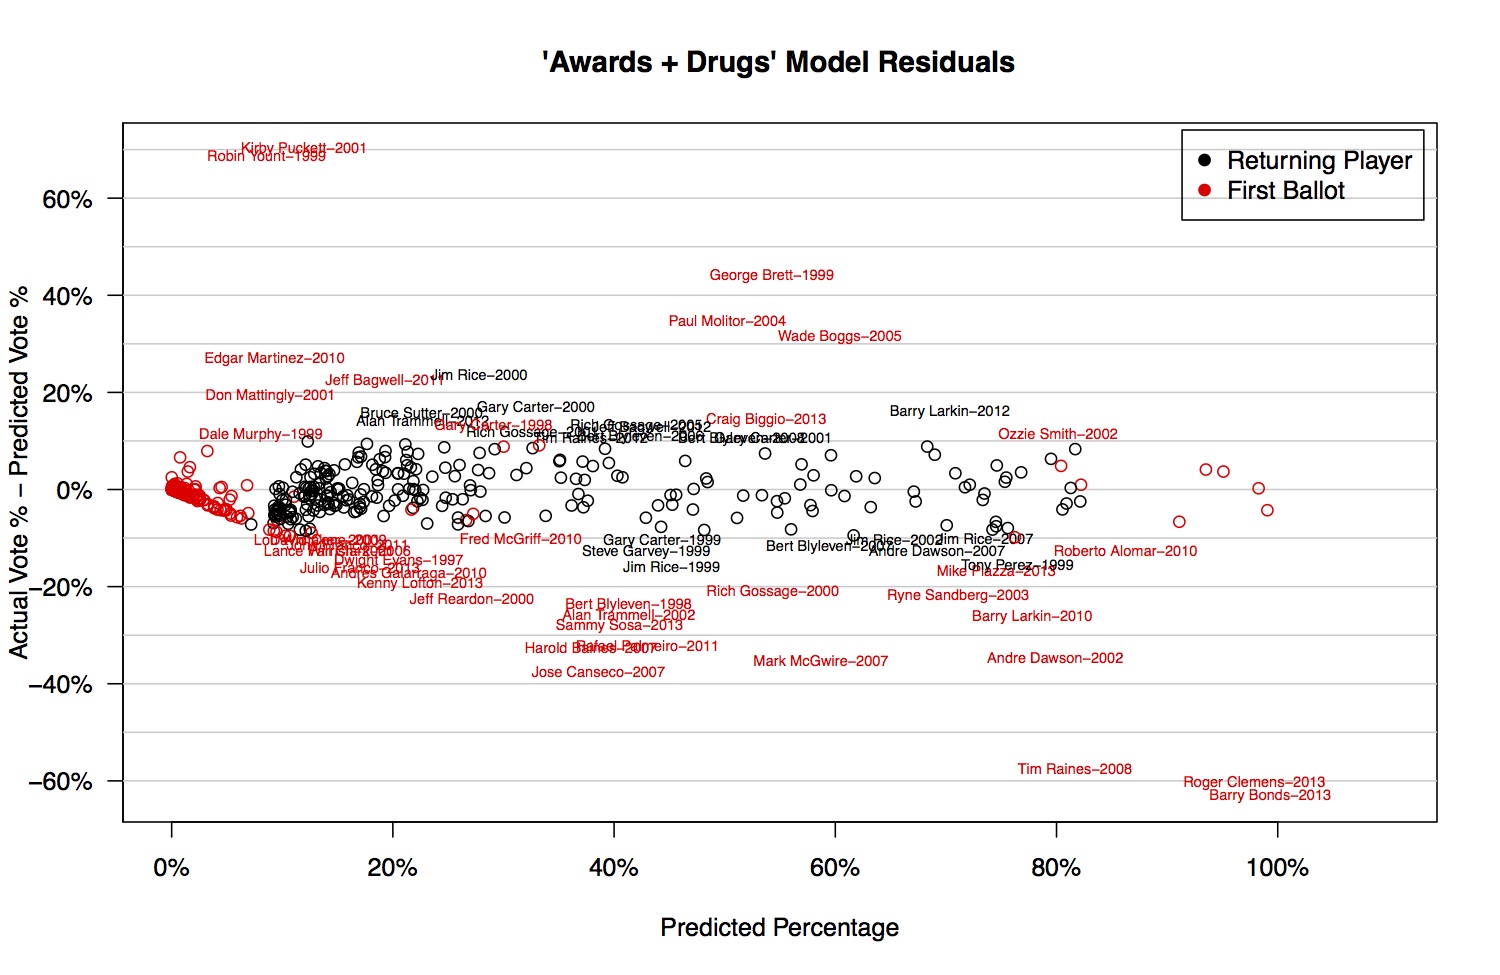
Residuals for 'Awards + Drugs' Model
Whew. At least now the results are plausible. Maddux is a lock, and Glavine and Thomas are above 50% (just barely).
Residual Analysis:
Top-5 and Bottom-5 residuals:
  Year          Name Actual Predicted Residual
1 2001 Kirby Puckett   82.1      12.0     70.1
2 1999   Robin Yount   77.5       8.6     68.9
3 1999  George Brett   98.2      54.3     43.9
4 2004  Paul Molitor   85.2      50.3     34.9
5 2005    Wade Boggs   91.9      60.4     31.4
  Year          Name Actual Predicted Residual
1 2013   Barry Bonds   36.2      99.3    -63.1
2 2013 Roger Clemens   37.6      97.9    -60.3
3 2008    Tim Raines   24.3      81.7    -57.4
4 2007  Jose Canseco    1.1      38.6    -37.5
5 2007  Mark McGwire   23.5      58.7    -35.2
Any thoughts?
We can try some milestones, like 3000 hits, and also a variable for 'Played for only one team entire career'.
Specifically, we'll add: Rookie of the Year, MVP, Cy Young, 3000 hits, 500 HR, 300 wins, 3000 strikeouts, and 'Oneteam' (there is a list available online for those with > 15 years of service. I cheated and included Puckett).
Improving the model for returning players
Previous Year's voting percentage
Previous Year's voting percentage squared (to model a potentially quadratic relationship)
"Top 3 First Ballot": The mean voting percentage of the top 3 first-ballot players in a given year. This variable we expect to have a negative association with a returning player's voting percentage, as it did in 1999, for example, when first-timers George Brett, Nolan Ryan, and Robin Yount all received very high voting percentages, and most returning players received a lower voting percentage than their previous year.
"Top 5 Returning Ballot": The mean of the top five voting percentages from the previous year of players who are re-appearing on this year's ballot; this should also have a negative correlation with the current year's voting percentages.
Indicator of whether this is a player's second or final ballot (two years in which an extra bump often occurs)
Interaction between indicator of second ballot and previous year's percentage -- included specifically to capture the fact that first-ballot players who get between 60 and 75% of the vote percentage tend to increase a lot in their second year.
All of this based on EDA and residual plots
Returning Player Updated Model
All the coefficients are statistically significant (so there's that, at least)
Do the predictions improve? Recall that the baseline RMSE for this group (n = 262) was 5.7%.
Well, it's not great that the 1st-ballot pitchers RMSE went up (adding milestones, or rookie of the year, or something made the model perform worse for them), but we'll keep the effect in.
One more change:
Let's add in a few interaction effects between the 'drugs' variable and slugging variables, since you could argue that drug use is more damaging to one's reputation (and helpful to one's career) for sluggers.
Include drugs × SLG and drugs × HR.
Also let's include 'drugs' interaction with MVP awards and Cy Young Awards (to additionally 'downweight' Clemens and Bonds -- a little bit of snooping here...)
With this change, our final 2014 predictions are:
          Name Previous Predicted
1      Greg Maddux      0.0      97.4
2     Craig Biggio     68.2      73.7
3      Jack Morris     67.7      70.2
4     Frank Thomas      0.0      64.2
5      Mike Piazza     57.8      63.7
6     Jeff Bagwell     59.6      60.4
7      Tom Glavine      0.0      53.5
8       Tim Raines     52.2      52.7
9        Lee Smith     47.8      47.7
10    Mike Mussina      0.0      42.4
11  Curt Schilling     38.8      38.5
12   Roger Clemens     37.6      36.8
13     Barry Bonds     36.2      34.8
14  Edgar Martinez     35.9      33.1
15   Alan Trammell     33.6      30.4
16    Larry Walker     21.6      17.5
17    Fred McGriff     20.7      16.7
18    Mark McGwire     16.9      13.5
19   Don Mattingly     13.2      10.8
20   Luis Gonzalez      0.0       9.6
21      Sammy Sosa     12.5       9.4
22     Moises Alou      0.0       8.7
23 Rafael Palmeiro      8.8       8.2
24       Jeff Kent      0.0       5.1
These predictions looked decent at the time, although I thought Frank Thomas should have been a bit higher.
Checking the 2014 Predictions (ouch!)
Lessons learned?
RMSE for 2014 was 9.9%, compared to 9.0% historically. Not terrible. But misleading since very low data points (< 2%, for example) are equally weighted in RMSE calculation. They're just not that interesting or important.
Postseason success might be a big factor. The data is a bit harder to gather.
Is there a teammate effect? (Maddux + Glavine?)
The predictions are dependent. We underestimated the first-ballot voting percentages in 2014, and thus, our model also overestimated the voting percentages of every returning player (because of the 'top-3' variable in the Group 3 = 'Returning' regression.)
Also, historical RMSE is fine to look at, but with Clemens/Bonds, there may have simply been no way for us to predict their voting percentages, since there were truly none like them before (in the modern era, or in any era when including the drugs variable).
2015 predictions (drum roll, please...)
Name Previous Predicted
1 Randy Johnson 0.0 99.8
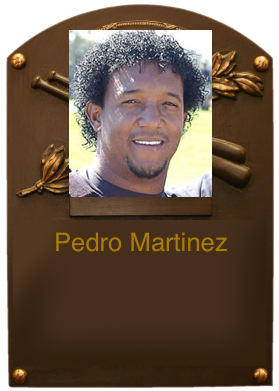
2 Pedro Martinez 0.0 93.5
3 John Smoltz 0.0 72.4
4 Craig Biggio 74.8 69.2
5 Mike Piazza 62.2 59.2
6 Jeff Bagwell 54.3 51.3
7 Tim Raines 46.1 41.9
8 Roger Clemens 35.4 29.3
9 Barry Bonds 34.7 28.5
10 Lee Smith 29.9 23.4
11 Curt Schilling 29.2 22.6
12 Edgar Martinez 25.2 18.7
13 Alan Trammell 20.8 14.9
14 Mike Mussina 20.3 13.8
15 Jeff Kent 15.2 9.9
16 Fred McGriff 11.7 8.7
17 Mark McGwire 11.0 8.3
18 Larry Walker 10.2 7.8
19 Don Mattingly 8.2 7.8
20 Nomar Garciaparra 0.0 7.8
21 Gary Sheffield 0.0 7.6
22 Sammy Sosa 7.2 6.4
23 Troy Percival 0.0 5.3
24 Carlos Delgado 0.0 1.9
2015 predictions (drum roll, please...)
                Name Previous Predicted
1      Randy Johnson      0.0      99.8
2     Pedro Martinez      0.0      93.5
3        John Smoltz      0.0      72.4
4       Craig Biggio     74.8      69.2
5        Mike Piazza     62.2      59.2
6       Jeff Bagwell     54.3      51.3
7         Tim Raines     46.1      41.9
8      Roger Clemens     35.4      29.3
9        Barry Bonds     34.7      28.5
10         Lee Smith     29.9      23.4
11    Curt Schilling     29.2      22.6
12    Edgar Martinez     25.2      18.7
13     Alan Trammell     20.8      14.9
14      Mike Mussina     20.3      13.8
15         Jeff Kent     15.2       9.9
16      Fred McGriff     11.7       8.7
17      Mark McGwire     11.0       8.3
18      Larry Walker     10.2       7.8
19     Don Mattingly      8.2       7.8
20 Nomar Garciaparra      0.0       7.8
21    Gary Sheffield      0.0       7.6
22        Sammy Sosa      7.2       6.4
23     Troy Percival      0.0       5.3
24    Carlos Delgado      0.0       1.9
???
2015 predictions (drum roll, please...)
                Name Previous Predicted
1      Randy Johnson      0.0      99.8
2     Pedro Martinez      0.0      93.5
3        John Smoltz      0.0      72.4
4       Craig Biggio     74.8      69.2
5        Mike Piazza     62.2      59.2
6       Jeff Bagwell     54.3      51.3
7         Tim Raines     46.1      41.9
8      Roger Clemens     35.4      29.3
9        Barry Bonds     34.7      28.5
10         Lee Smith     29.9      23.4
11    Curt Schilling     29.2      22.6
12    Edgar Martinez     25.2      18.7
13     Alan Trammell     20.8      14.9
14      Mike Mussina     20.3      13.8
15         Jeff Kent     15.2       9.9
16      Fred McGriff     11.7       8.7
17      Mark McGwire     11.0       8.3
18      Larry Walker     10.2       7.8
19     Don Mattingly      8.2       7.8
20 Nomar Garciaparra      0.0       7.8
21    Gary Sheffield      0.0       7.6
22        Sammy Sosa      7.2       6.4
23     Troy Percival      0.0       5.3
24    Carlos Delgado      0.0       1.9
It's kind of nice to be able to make these predictions now, as opposed to only after some of the ballots have been returned, as others do.
Next Steps?
Model each individual's trajectory as a line (or curve), rather than just modeling an individual year using the previous year.
Use some postseason information to see if that helps predictions.
A multivariate model is hard since so few writers release their full ballots.
Next Steps?
Big takeaway? Visual exploratory data analysis is useful!
Thanks for coming tonight.
Code on github:
cscheid/mlb-hall-of-fame-voting/
kshirley/HOFmodel/
Slides will go on my website shortly: www.research.att.com/~kshirley
And thanks to Bryan Kaufman for organizing the meetup!


 Whew. At least now the results are plausible. Maddux is a lock, and Glavine and Thomas are above 50% (just barely).
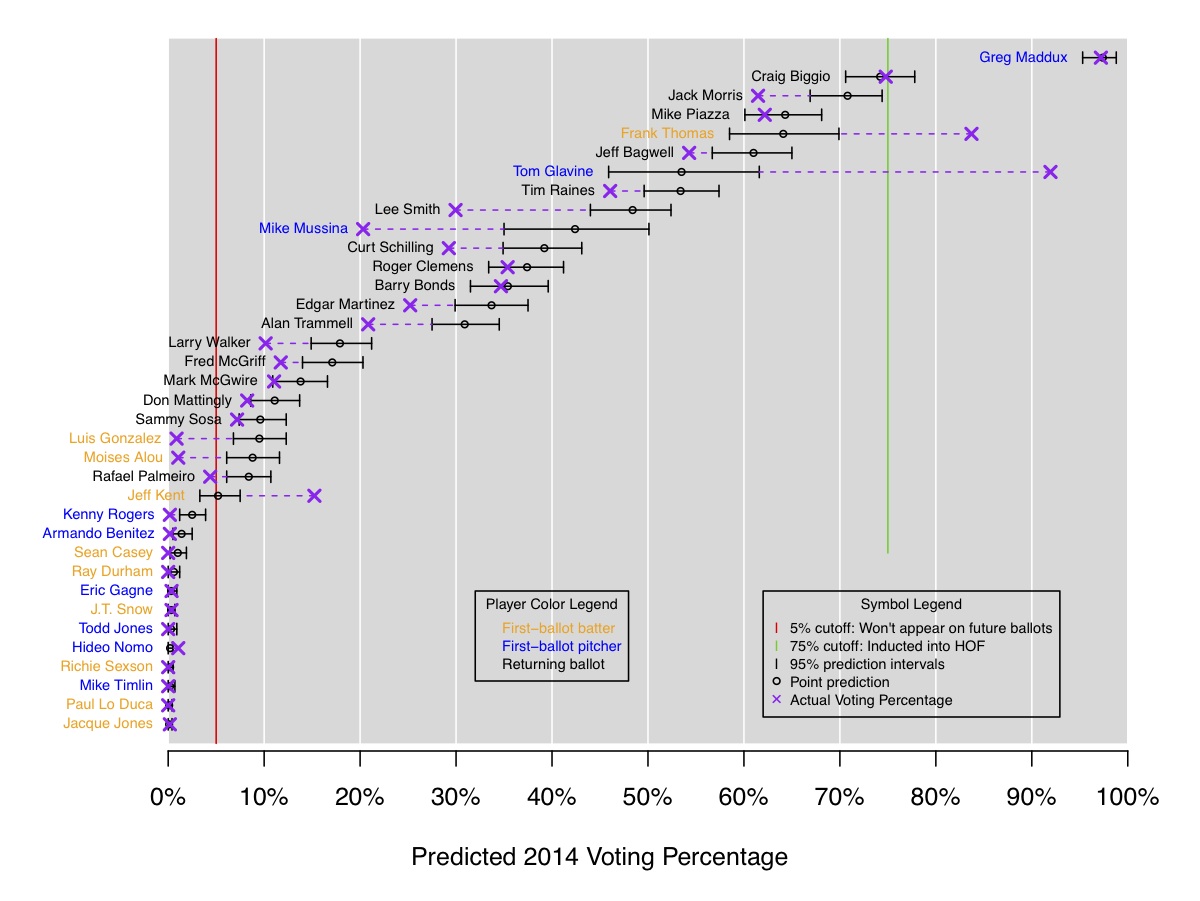

 ???
???